All of it has been readable since the site went up — it was just never written down anywhere. Nothing here needs a key, nothing is rate limited, and nothing you do to it costs anyone an API call: every file is written on a schedule by the fetcher and served from disk, so a thousand readers cost exactly what one does.
Every day this station has recorded: means, extremes, rainfall and estimated sunshine. Units are in the header of every column.
daily.csvThe same figures rolled up by calendar month, with the number of days actually observed in each — which is what says whether a month’s average means anything.
monthly.csvDaily rather than every minute. The archive holds a record a minute, which is a hundred and fifty megabytes a year and not something this station has any business serving over a domestic connection. The daily summaries are the natural grain for the questions a spreadsheet gets asked — how wet was that month, when did it last freeze, is the station drifting — and every statistic on this site is built from the same summaries, so the CSV and the pages agree by construction rather than by coincidence. If you genuinely want the minutes, ask; that is what the address on the metadata page is for.
Two different means, on purpose.
temp_mean_c in the daily file is the average of every
reading in the day. In the monthly file, temp_mean_c is the
average of daily (max + min) / 2 — the
climatological definition, so it can be compared with published normals
— and temp_mean_24h_c beside it is the true mean. The
difference is a couple of tenths of a degree and it is not noise: the
old definition sits high wherever days warm faster than they cool.
Empty cells mean no reading, never zero. A missing sunshine figure means that day has not been counted rather than that the sun did not shine, and a missing rainfall means the gauge was not reporting rather than that it was dry.
These are not a second API built for visitors — they are the files the pages on this site fetch, which is the point: there is nothing here the dashboard knows and you do not.
Two shapes, and you have to check which. Anything
fetched from an outside service is wrapped as
{"fetched_at": …, "data": …} so the age of the copy is
beside it — that is met_eireann, marine,
air_quality, solar, astro,
aurora and visitors. Anything computed here
from this station’s own archive is written at the top level with no
wrapper, carrying its own generated timestamp instead:
history, climate, records,
onthisday, growing, sunshine,
scores, spots, bandscore,
satellites, satpos and health.
That split is historical rather than principled, and this page said all
of them were wrapped until somebody read a file and found otherwise. The
dashboard’s own code has always accepted either shape — payload.data
|| payload — which is why the discrepancy went unnoticed, and is
the safe thing for a reader to do too.
| Endpoint | What it is | Written |
|---|---|---|
| /api/history.json | 24 hours of observations at one-minute resolution, plus today’s statistics, records and rainfall to date. The largest file here and the one the charts are drawn from. | 1 min |
| /api/climate.json | Every calendar month on record, with the observed-day count that qualifies each one. | 1 h |
| /api/records.json | Every extreme this station has measured, this year and all time, each with the moment it was set. | 15 min |
| /api/onthisday.json | This calendar date in every year the archive holds. | 15 min |
| /api/growing.json | Growing degree days, T-sum, season length and air frost. | 1 h |
| /api/sunshine.json | Sunshine duration estimated from the light sensor, with the clear-sky curve it was judged against. | 5 min |
| /api/astro.json | Sun and moon for this position, and the subsolar point. | 5 min |
| /api/health.json | Sensor batteries and radio link, which never reach the archive. | 2 min |
| /api/scores.json | Every forecast provider scored against what this station actually measured, by lead time, with persistence as the baseline. | 1 h |
| /api/met_eireann.json | The Met Éireann forecast, parsed. | 1 h |
| /api/marine.json | Tide predictions, modelled sea state, the buoy network and the storm surge residual. | 1 h |
| /api/climatology.json | This station against the long record at the nearest official one: two baselines, the change between them, and the monthly anomalies — each with the coverage it rests on. | 24 h |
| /api/climate_normals.json | The anchor station's monthly series and published averages, as parsed. Met Éireann's figures, not this station's. | 24 h |
| /api/metar.json | Aerodrome reports from the nearest airport, parsed — the only visibility figure anywhere on this site, because this station has no sensor that can measure it. | 15 min |
| /api/met_observations.json | Present weather at the nearest coastal synoptic station, parsed — the better-sited half of the fog check, and the half with no visibility figure. | 15 min |
| /api/fogscore.json | The sea fog criterion scored against both observers, kept apart: a coastal station at this station's own height that reports words, and an aerodrome thirty kilometres away and uphill that reports metres. | 1 h |
| /api/air_quality.json | Air quality and pollen. Modelled — there is no analyser on this station. | 1 h |
| /api/solar.json | Solar indices, HF band conditions and seven days of planetary K index. | 30 min |
| /api/spots.json | Who has decoded this station, from PSK Reporter, with the history kept here because the service does not keep it. | 10 min |
| /api/bandscore.json | The band-condition model scored against the decodes it predicts. | 1 h |
| /api/satellites.json | Satellite passes over this station, when enabled. | 6 h |
| /api/satpos.json | Where those satellites are now, with two hours of ground track a minute apart and whether each is in sunlight. | 2 min |
| /api/aurora.json | Whether the aurora is worth walking outside for, at these coordinates. | 5 min |
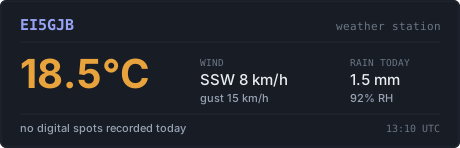
| /api/badge.svg | Current conditions as an image, for embedding elsewhere. | 5 min |
| /station.json | Position, sensor heights, instruments and known limitations — the metadata page as data. | on deploy |
The observations are this station’s own and you may do as you
like with them — publish them, plot them, cite them, feed them
to something. A credit and a link back is appreciated and is not a
condition. That covers the daily and monthly CSVs and everything in
history, climate, records,
onthisday, growing, sunshine,
health and astro.
How to cite it. Nothing formal is required, but if you need a form, this one carries what a reader would have to know to find the same numbers again:
EI5GJB weather station, Shanagarry, East Cork, Ireland (51.852, −8.040). Observations retrieved date from https://ei5gjb.com/data.html
The position is quoted to three decimals because that is the precision this station publishes — about a hundred metres. Anything more would be inventing accuracy the coordinates do not have. Questions, or anything the terms below do not obviously cover, to [email protected].
The rest is somebody else’s and travels with their terms. Passing it through this server does not relicense it, and the honest thing is to name who it belongs to rather than to leave a reader assuming it is all ours:
| Tides, buoys, surge | Marine Institute — CC BY 4.0, so attribution is required wherever it appears |
| Forecast and warnings | Met Éireann, under their own terms |
| Sea state, air quality, pollen | Open-Meteo, over Copernicus CAMS and ECMWF model output |
| Solar indices and band conditions | N0NBH; K index from NOAA SWPC |
| Reception reports | PSK Reporter — the reports are the receiving operators’, not this station’s |
| Satellite element sets | CelesTrak |
| Coastal present weather, climate normals and the anchor station's record | Met Éireann, under their own terms — the observations and the thirty-year averages are theirs, and the recent-period baseline is arithmetic done here on their data |
| Aerodrome reports | NOAA Aviation Weather Center — the observations are the aerodrome’s, and the raw report is republished here unaltered so that it can be read rather than taken on trust |
The scoreboard is a special case worth stating plainly: it contains other people’s forecasts and how wrong they were. The error figures are this station’s measurement and the forecasts are theirs.
Poll politely, but do not worry about it. Nothing you request triggers an upstream call — every file is written on a schedule whether anyone is reading or not — so the only cost of a fast poll is bandwidth. The Written column above is how often each file can actually change; asking more often than that returns the same bytes.
There is no version number and no promise of one. This is a home station, the shapes change when a panel changes, and pretending otherwise would be a commitment nobody here can keep. Fields get added far more often than removed. If you are depending on something, say so — it is a good deal more likely to survive if somebody knows it is there.
A missing value is null, never zero. That
rule holds everywhere on this site and in these files. A station
reporting 0.0 when it means “no reading” is lying, and every panel here
renders an em dash instead.
Times are epoch seconds where they come from this station and ISO strings where they come from a source that published them that way. Not tidied into one, because the conversion is where time zones get lost — the tide times are UTC with a trailing Z and the model series are local wall-clock with no offset, and both are correct as published.
The station keeps recording during an internet outage. Readings are polled from the gateway over the local network and archived locally; nothing passes through a manufacturer’s cloud. If these files stop updating, the observations behind them did not.